


Lesson 4:Support And Resistance
Support and Resistance
Support and resistance is one of the most widely used concepts in trading.
Strangely enough, everyone seems to have their own idea on how you should measure support and resistance.
Let’s take a look at the basics first.
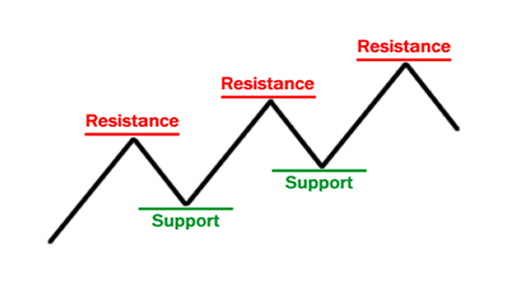
Look at the diagram above.
As you can see, this zigzag pattern is making its way up (bull market).
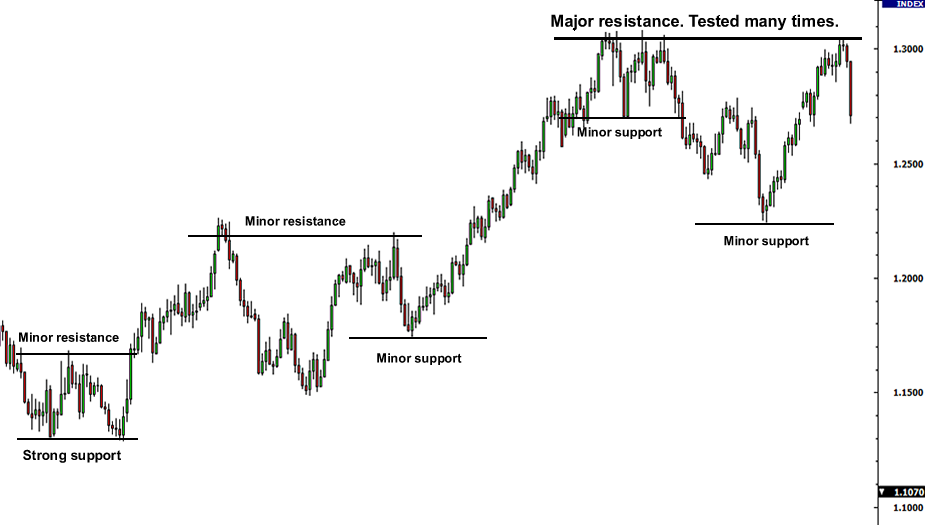
When the market moves up and then pulls back, the highest point reached before it pulled back is now resistance.
As the market continues up again, the lowest point reached before it started back is now support.
In this way resistance and support are continually formed as the market oscillates over time.
The reverse is true for the downtrend.
Plotting Support and Resistance
One thing to remember is that support and resistance levels are not exact numbers.
Often times you will see a support or resistance level that appears broken, but soon after find out that the market was just testing it. With candlestick charts, these “tests” of support and resistance are usually represented by the candlestick shadows.
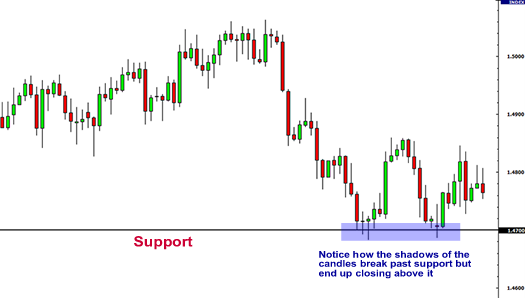
Notice how the shadows of the candles tested the 1.4700 support level.
At those times it seemed like the market was “breaking” support.
In hindsight we can see that the market was merely testing that level.
So how do we truly know if support and resistance was broken?
There is no definite answer to this question.
Some argue that a support or resistance level is broken if the market can actually close past that level. However, you will find that this is not always the case.
Let’s take our same example from above and see what happened when the price actually closed past the 1.4700 support level.
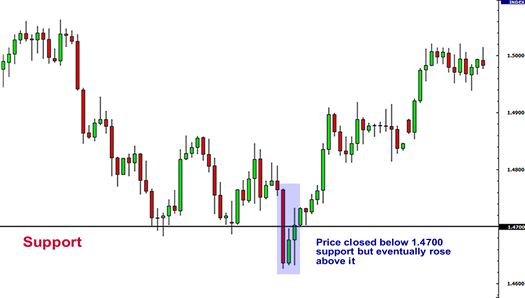
In this case, price had closed below the 1.4700 support level but ended up rising back up above it.
If you had believed that this was a real breakout and sold this pair, you would’ve been seriously hurtin’!
Looking at the chart now, you can visually see and come to the conclusion that the support was not actually broken; it is still very much intact and now even stronger.
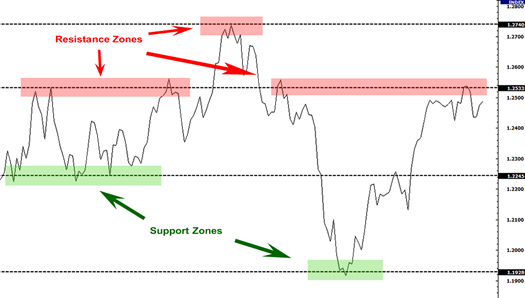
To help you filter out these false breakouts, you should think of support and resistance more of as “zones” rather than concrete numbers.
One way to help you find these zones is to plot support and resistance on a line chart rather than a candlestick chart.
The reason is that line charts only show you the closing price while candlesticks add the extreme highs and lows to the picture.
These highs and lows can be misleading because often times they are just the “knee-jerk” reactions of the market.
It’s like when someone is doing something really strange, but when asked about it, he or she simply replies, “Sorry, it’s just a reflex.”
When plotting support and resistance, you don’t want the reflexes of the market. You only want to plot its intentional movements.
Looking at the line chart, you want to plot your support and resistance lines around areas where you can see the price forming several peaks or valleys.
Other interesting tidbits about support and resistance:
- When the price passes through resistance, that resistance could potentially become support.
- The more often price tests a level of resistance or support without breaking it, the stronger the area of resistance or support is.
- When a support or resistance level breaks, the strength of the follow-through move depends on how strongly the broken support or resistance had been holding.
With a little practice, you’ll be able to spot potential support and resistance areas easily.
In the next lesson, we’ll teach you how to trade diagonal support and resistance lines, otherwise known as trend lines.
Trading the Lines
Now that you know the basics, it’s time to apply these basic but extremely useful technical tools in your trading.
Because here at BabyPips.com we want to make things easy to understand, we have divided trading support and resistance levels into two simple ideas: the Bounce and the Break.
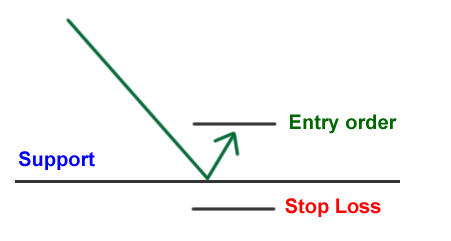
The Bounce
As the name suggests, one method of trading support and resistance levels is right after the bounce.
Many retail traders make the error of setting their orders directly on support and resistance levels and then just waiting to for their trade to materialize.
Sure, this may work at times but this kind of trading method assumes that a support or resistance level will hold without price actually getting there yet.
You might be thinking, “Why don’t I just set an entry order right on the line? That way, I am assured the best possible price”.
When playing the bounce we want to tilt the odds in our favor and find some sort of confirmation that the support or resistance will hold.
Instead of simply buying or selling right off the bat, wait for it to bounce first before entering.
By doing this, you avoid those moments where price moves fast and break through support and resistance levels.
From experience, catching a falling knife can get really bloody…
The Break
In a perfect world, support and resistance levels would hold forever, McDonalds would be healthy, and we’d all have jetpacks. In a perfect trading world, we could just jump in and out whenever price hits those major support and resistance levels and earn loads of money. The fact of the matter is that these levels break… often.
So, it’s not enough to just play bounces.
You should also know what to do whenever support and resistance levels give way! There are two ways to play breaks: the aggressive way or the conservative way.
The Aggressive Way
The simplest way to play breakouts is to buy or sell whenever price passes convincingly through a support or resistance zone.
The key word here is convincingly because we only want to enter when price passes through a significant support or resistance level with ease.
We want the support or resistance area to act as if it just received a Chuck Norris karate chop: We want it to wilt over in pain as price breaks right through it.
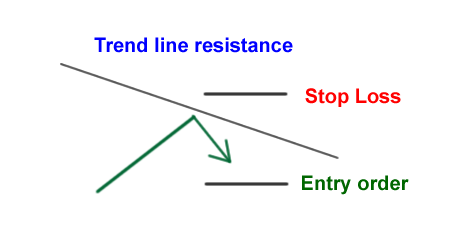
The Conservative Way
Imagine this hypothetical situation: you decided to go long EUR/USD hoping it would rise after bouncing from a support level.
Soon after, support breaks and you are now holding on to a losing position, with your account balance slowly falling.
Do you…
- Accept defeat, get the heck out, and liquidate your position?
OR
- Hold on to your trade and hope price rises up again?
If your choice is the second one, then you will easily understand this type of trading method.
Remember, whenever you close out a position, you take the opposite side of the trade.
Closing your EUR/USD long trade at or near breakeven means you will have to short the EUR/USD by the same amount.
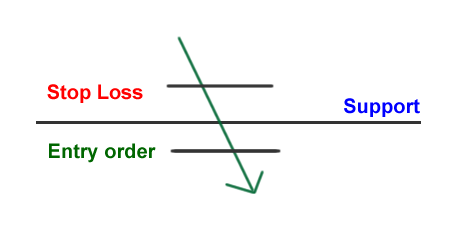
Now, if enough selling and liquidation of losing positions happens at the broken support level, price will reverse and start falling again.
This phenomenon is the main reason why broken support levels become resistance whenever they break.
As you would’ve guessed, taking advantage of this phenomenon is all about being patient.
Instead of entering right on the break, you wait for price to make a “pullback” to the broken support or resistance level and enter after the price bounces.
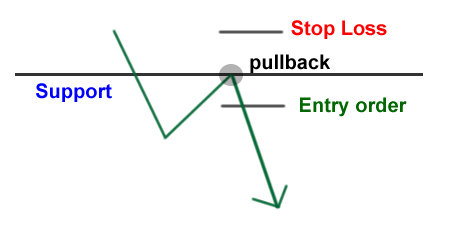
A few words of caution… THIS DOES NOT HAPPEN ALL THE TIME.
“RETESTS” OF BROKEN SUPPORT AND RESISTANCE LEVELS DO NOT HAPPEN ALL THE TIME.
THERE WILL BE TIMES THAT PRICE WILL JUST MOVE IN ONE DIRECTION AND LEAVE YOU BEHIND.
BECAUSE OF THIS, ALWAYS USE STOP LOSS ORDERS AND NEVER EVER HOLD ON TO A TRADE JUST BECAUSE OF HOPE.